Greenhouse VPD analysis: how sensor choice changes alerts
Hamfy analysed 43 days of public lettuce greenhouse data. Two sensor streams disagreed on a 0.4 kPa VPD flag in 39.7% of matched time. Explore the calculations and download the data.
Explore the guide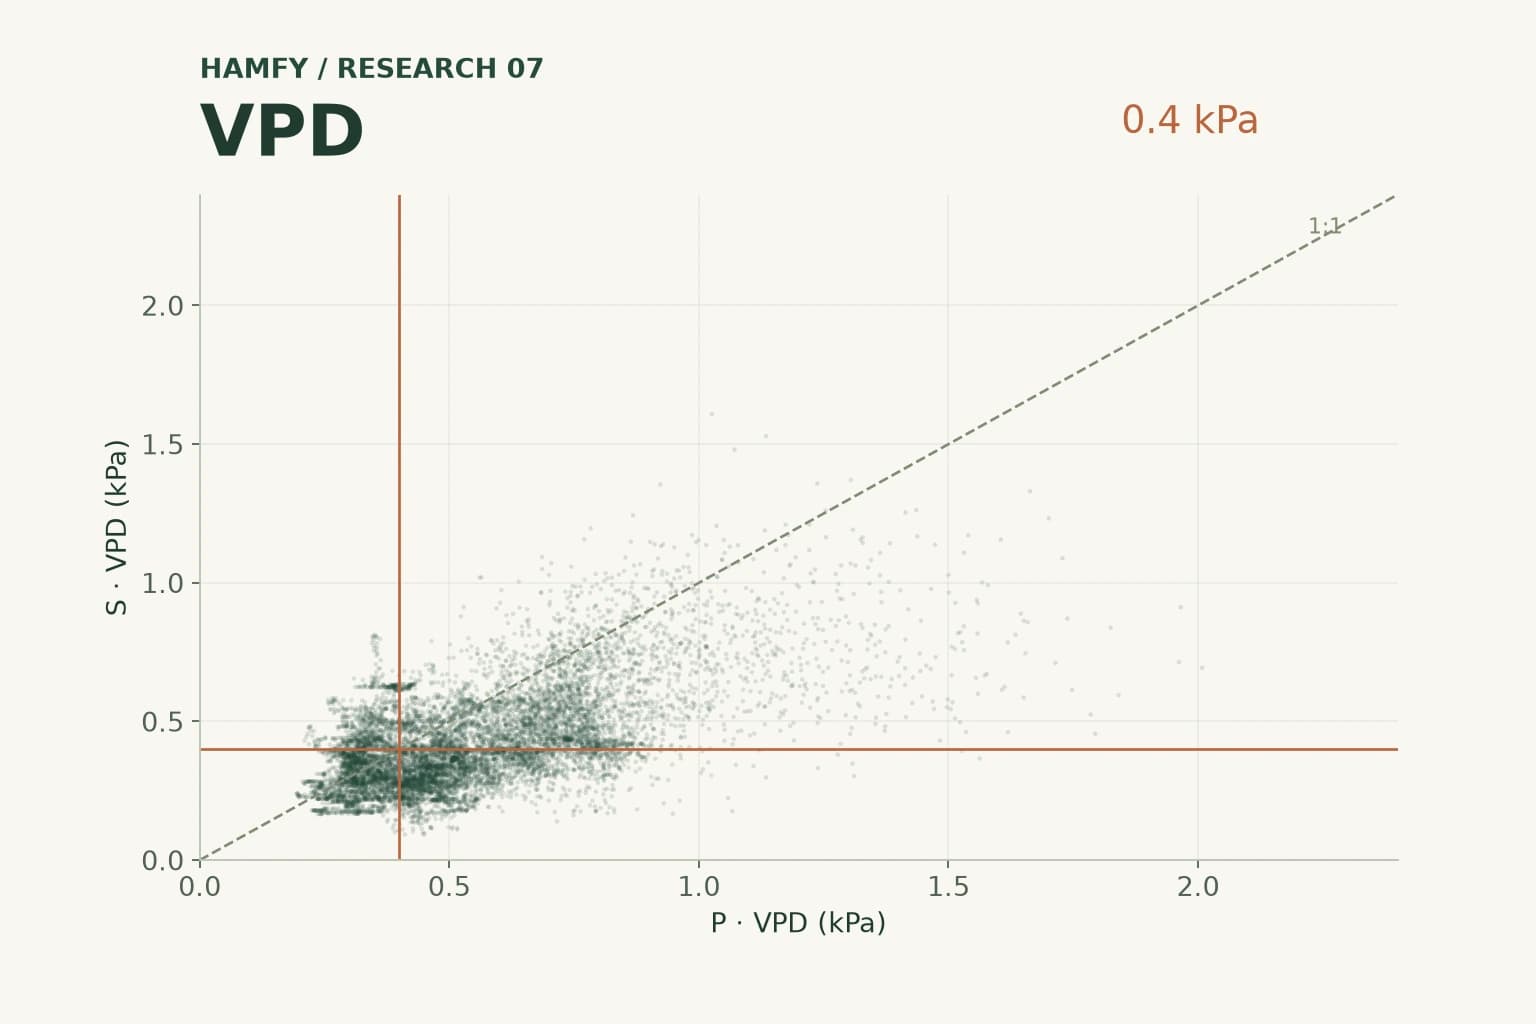
A climate threshold depends on the measurements behind it. We audited two temperature–humidity streams from the same greenhouse compartment, calculated air VPD and compared the review flags over exactly the same available intervals.
39.7% disagreement
At a strict 0.4 kPa threshold, the two streams classified 372 h 20 min of matched time differently. These are review intervals, not a count of actual alarms.
Compare the same periods
The comparison uses 938 h 05 min with both streams available. Using each stream’s full record would mix sensor differences with differences in data availability.
Verify before adjusting control
The export reveals disagreement, but cannot identify which measurement represents the crop better. Placement, calibration and logging need checking.
What we analysed
We used the complete Reference compartment climate export from the first lettuce experiment of the third Autonomous Greenhouse Challenge in Bleiswijk, Netherlands. It contains 12,384 records dated 1 February–15 March 2022. This is greenhouse data; the findings are not measurements from a sealed indoor farm. The source dictionary identifies temperature in °C and relative humidity in percent.
We call Tair / Rhair the primary stream, P, and Tair_sigrow / Rhair_sigrow the Sigrow stream, S. ‘Primary’ is a label for the columns, not a claim of superior accuracy. We selected the named Reference compartment before calculating the comparison and retained its entire published period. The task is an audit of measurement streams, not a ranking of competition teams.
Check the missing measurements first
P has 12,359 valid temperature–humidity pairs and 25 missing pairs. S has 11,283 valid pairs and 1,101 missing pairs: 99.8% versus 91.1% row availability. The longest consecutive missing block in S lasts 69 h 35 min on the normalized clock. That is missing information in an export, not proof that an instrument stopped working.
Recorded timestamps alternate between 4, 5 and 6 minutes. Rounding to the nearest five-minute grid moves 5,504 timestamps forward by one minute and produces a complete grid without duplicates. We change no temperature or humidity values and fill no gaps. The final timestamp contributes no duration because there is no following observation. Keeping the original irregular intervals changes either below-threshold share by less than 0.02 percentage points.
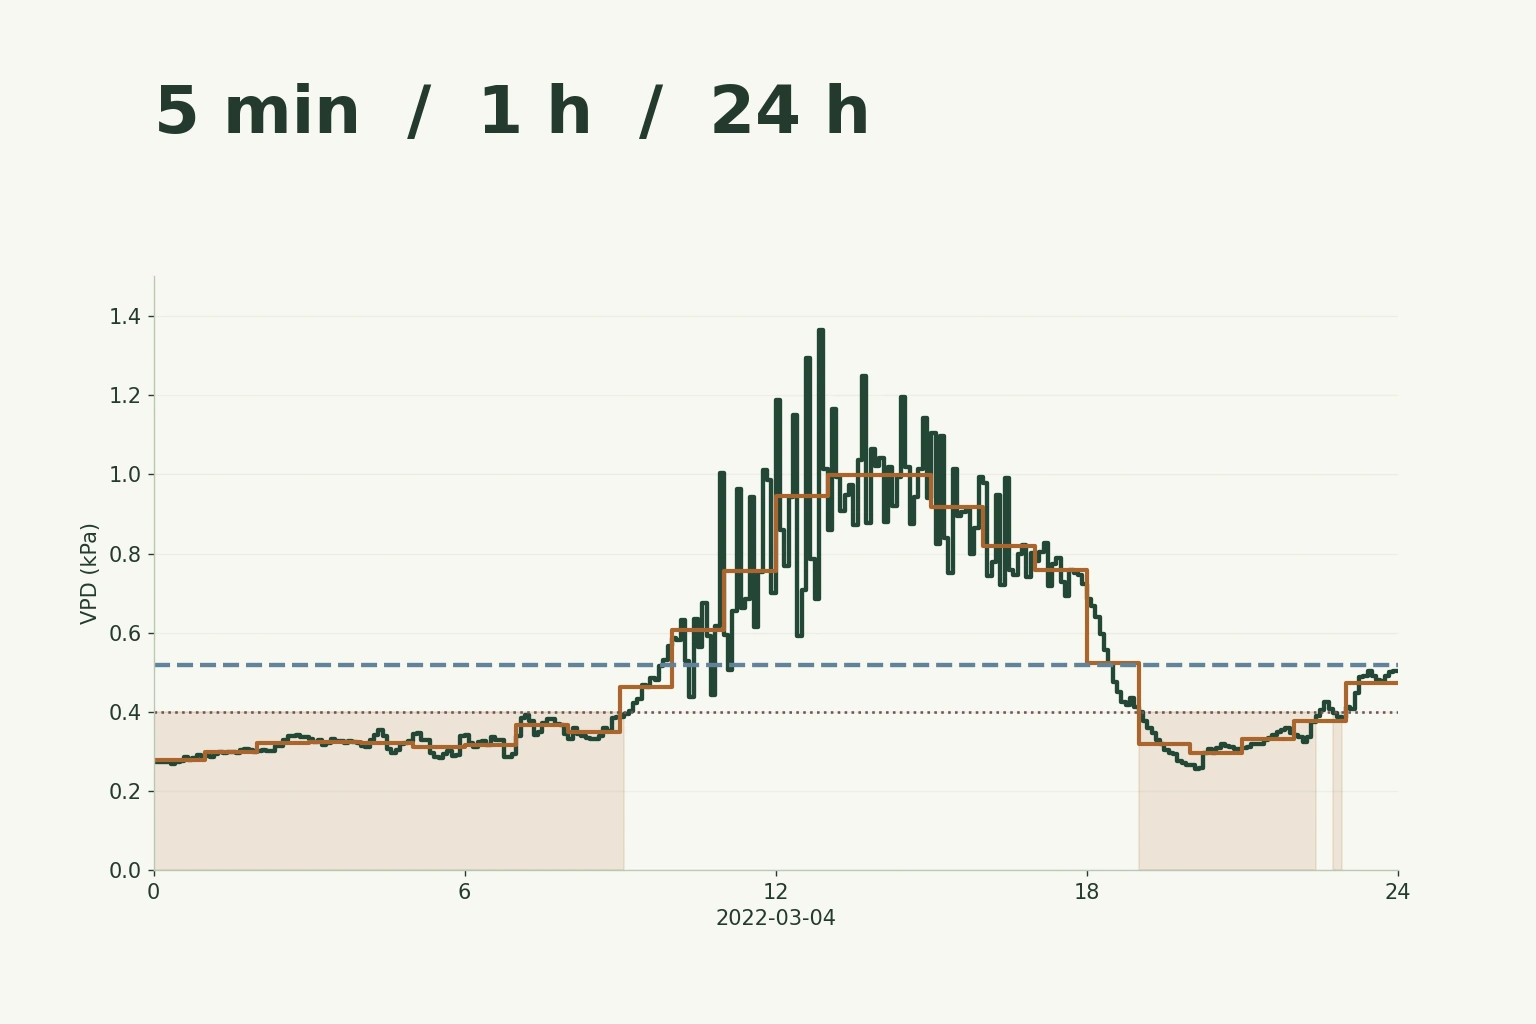
The daily pattern and the data behind it
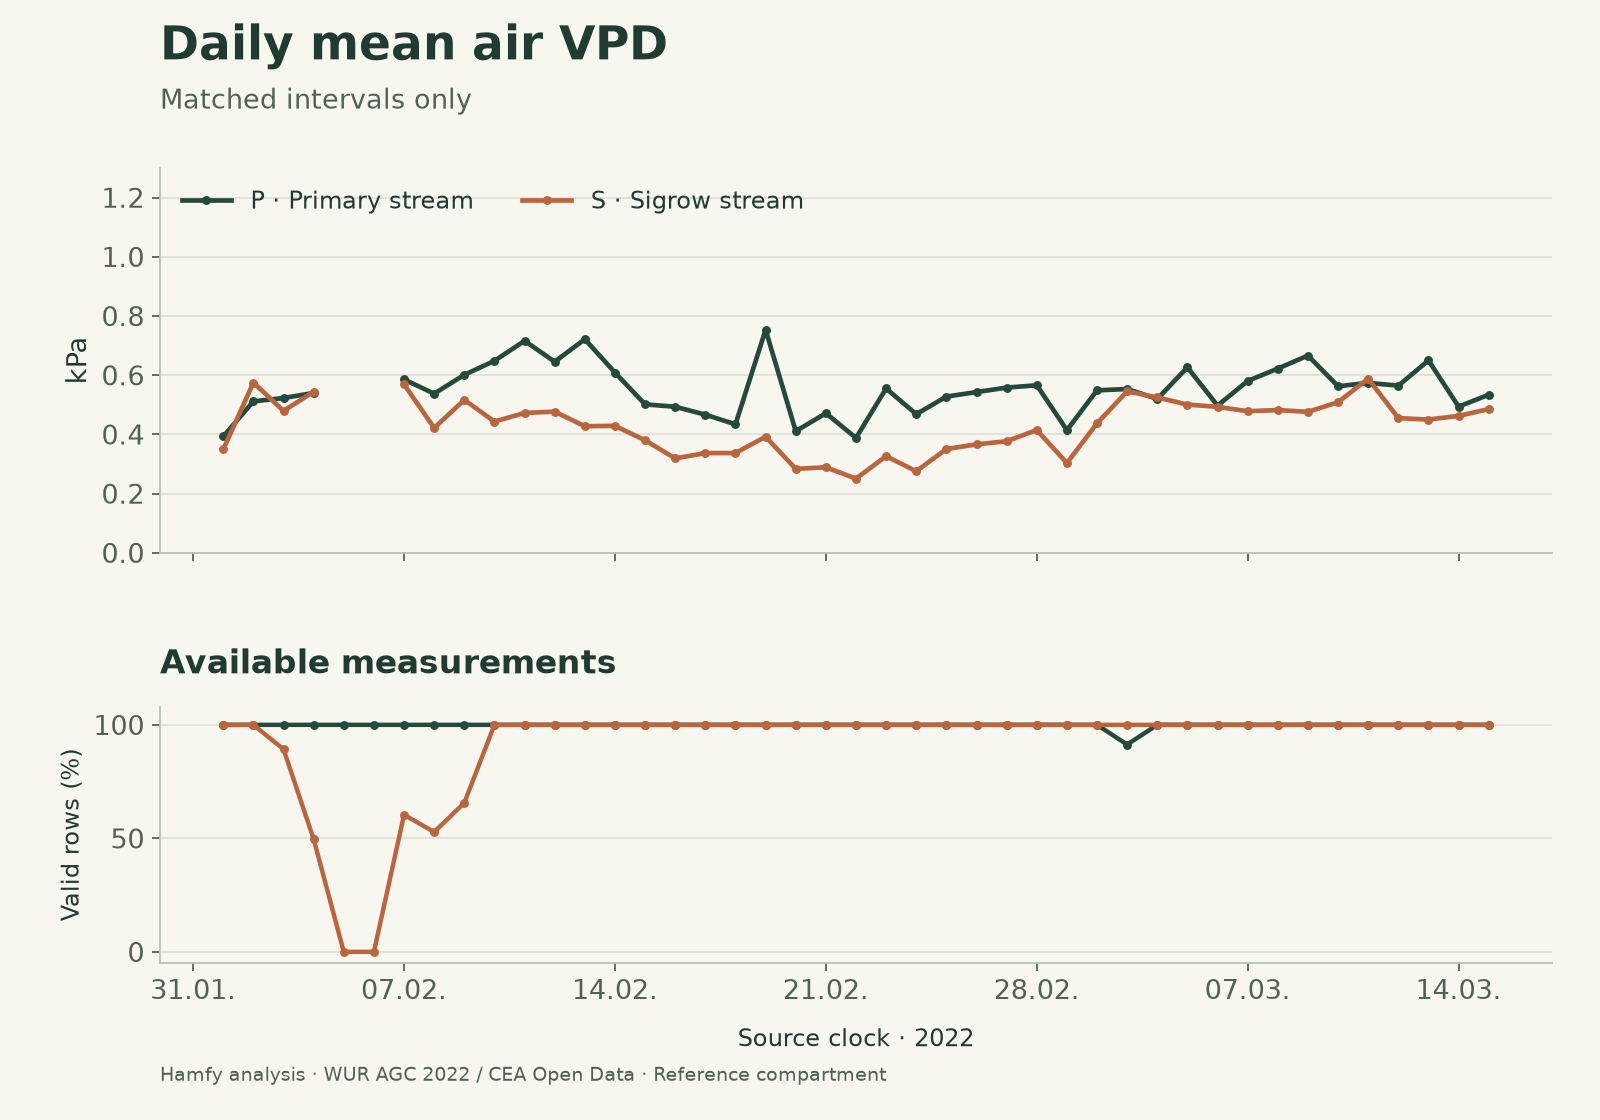
One review rule, two different answers
For each available pair we calculate air VPD as 0.6108 × exp(17.27T / (T + 237.3)) × (1 − RH/100), in kPa. This uses the saturation-pressure relationship in FAO-56. We calculate each interval before averaging, use no leaf-temperature estimate and hold a reading for at most five minutes.
There are 11,258 rows with both streams available, yielding 11,257 contributing intervals and 938 h 05 min of matched time. Mean air VPD is 0.550 kPa for P and 0.425 kPa for S. On those same intervals, S averages 1.51 °C warmer and 7.31 percentage points more humid. These are differences between streams, not calibrated sensor errors.
At our selected review threshold of VPD < 0.4 kPa, P is below for 279 h 35 min and S for 498 h 05 min. They disagree in 4,468 intervals, or 39.7% of matched time. The threshold is an analytical rule, not a recommended lettuce setpoint or a reconstruction of the experiment’s actual alarms. The table shows how the result changes when we change that rule.
Sensitivity to the selected VPD threshold
| Threshold (kPa) | P below (%) | S below (%) | Disagreement (%) |
|---|---|---|---|
| 0.3 | 7.6 | 25.0 | 24.1 |
| 0.4 | 29.8 | 53.1 | 39.7 |
| 0.5 | 50.7 | 73.6 | 33.3 |
| 0.6 | 64.9 | 85.8 | 26.1 |
What this changes in an operational review
Our conclusion is to verify the measurement chain before changing a control threshold. A controller can follow its configured rule consistently while a second measurement stream suggests a different climate. The export alone cannot separate sensor position, local microclimate, calibration, processing and logging effects.
For a comparable review in an operating farm, we would map sensor locations and heights, record maintenance and calibration, and compare instruments side by side against a documented reference. We would then assess the actual controller’s averaging, alarm delay and hysteresis. These follow-up measurements were not performed in this analysis.
The repeated five-minute observations are not independent trials. This single-compartment result establishes neither crop damage nor energy savings, and it cannot rank the sensors’ accuracy. Its practical value is a reproducible method for checking the inputs used by climate control and VPD calculations.
Download the data and repeat our calculation
The complete package contains the unchanged source file, license notices, a documented method, a Python script, derived CSVs, numerical results and our charts. The calculation script uses Python’s standard library and checks the source file’s SHA-256 before running. A separate chart script documents the plotting step.
To repeat the matched comparison in the Hamfy sensor analyser, upload the paired P and S files separately. Set the sampling interval to 5 minutes, UTC offset to +1 and the VPD range to 0.4–1.6 kPa. Compare mean air VPD and the time below the minimum. Both files retain identical gaps and cover 938 h 05 min. The source timezone is unspecified; +1 is an export assumption and does not affect this paired comparison.
We verified the results independently with pandas/NumPy and with Hamfy’s existing analyser. The method and findings distinguish observed values, processing choices and what still requires a field check.
Common questions
Is this Hamfy’s own research?
Hamfy performed this original secondary analysis: data validation, paired VPD calculations, threshold comparison, charts and interpretation. The underlying experiment and measurements belong to the named public source. We did not operate or instrument that greenhouse.
Does the difference mean one sensor is wrong?
No. A disagreement between measurement streams is not a calibration test. Different positions, local conditions, processing and instrumentation can all contribute. The next step is a documented measurement comparison, not automatically replacing a sensor or copying a new setpoint.
Sources & research
Primary sources selected for this article. Reviewed by Hamfy on .
Sensor choice and VPD flags: Hamfy’s method and findingsRead the research brief · scope, findings and limitations- Public measurement dataset · 2022 / 2023International Autonomous Greenhouse Challenge — 3rd edition, 1st experiment: dataset and dictionaryAutonomous Greenhouse Challenge organizers / Koala Team, Koidra Tech Inc. / CEA Open Data
Reference compartment, complete GreenhouseClimate.csv. The pinned distribution declares the MIT license; its permission notice and the unchanged input are included in the download. Hamfy calculated the findings presented here.
- Calculation reference · 1998FAO Irrigation and Drainage Paper 56 — Chapter 3: Meteorological dataFood and Agriculture Organization of the United Nations
Reference for the relationship between air temperature, saturation vapour pressure and relative humidity. It does not validate our selected 0.4 kPa review threshold for this crop.
Have a correction or additional project evidence? Contact the Hamfy team.
Need a technical review of your growing data?
Turn sensor exports into a clear report on measurement quality, climate patterns and the checks that matter next.