What daily VPD averages hide: a 41-day greenhouse analysis
Hamfy analysed 41 complete days of public greenhouse data. Daily means hid 90.5% of time below a 0.4 kPa review threshold. Explore the charts and method.
Explore the guide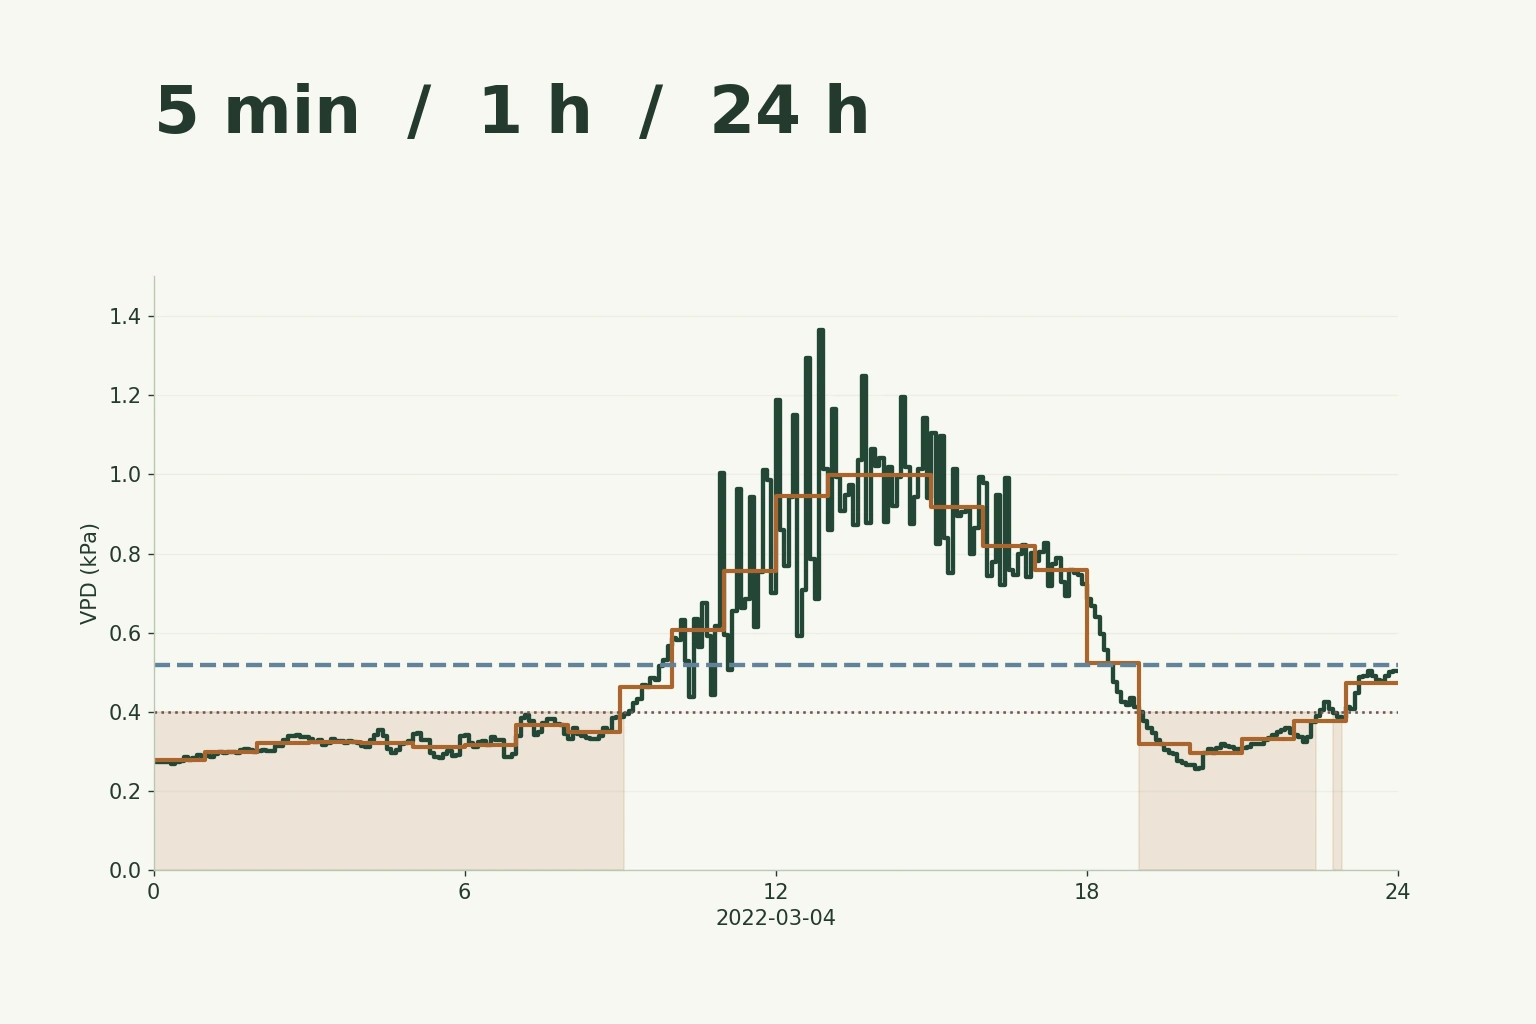
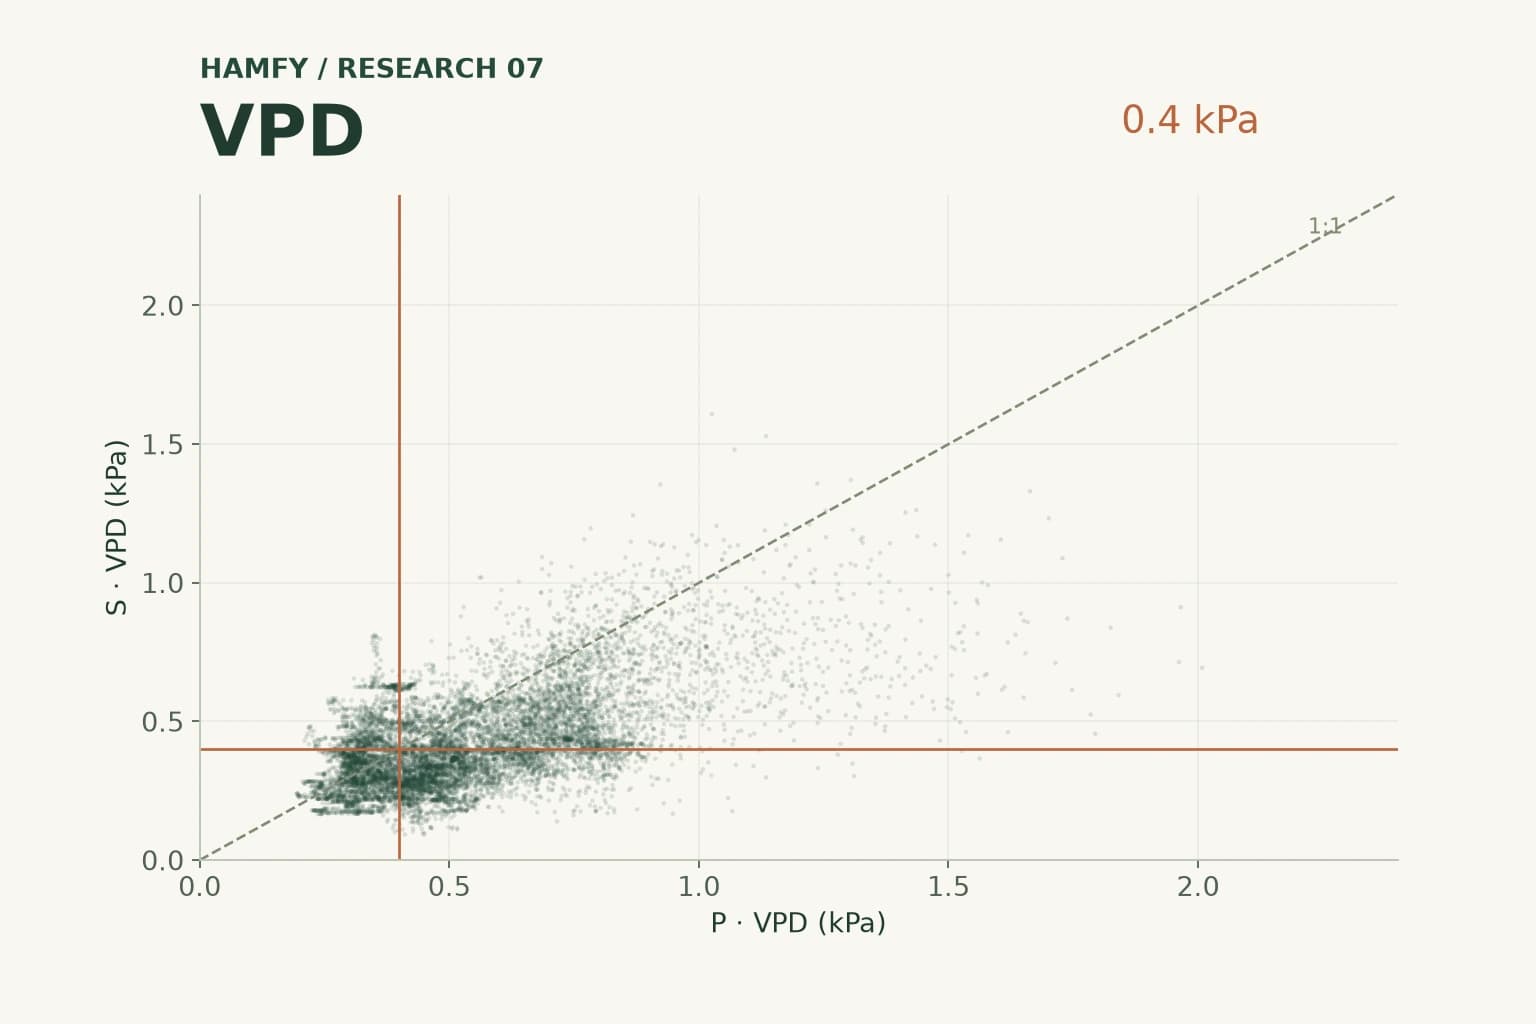
A daily mean can be correct and still hide the timing of low VPD. Across 41 complete days, the overall mean stays at 0.545 kPa at every resolution. Yet classifying daily averages misses 255 h 45 min that the five-minute record places below 0.4 kPa. Averages answer a different question from time outside a threshold.
90.5% hidden
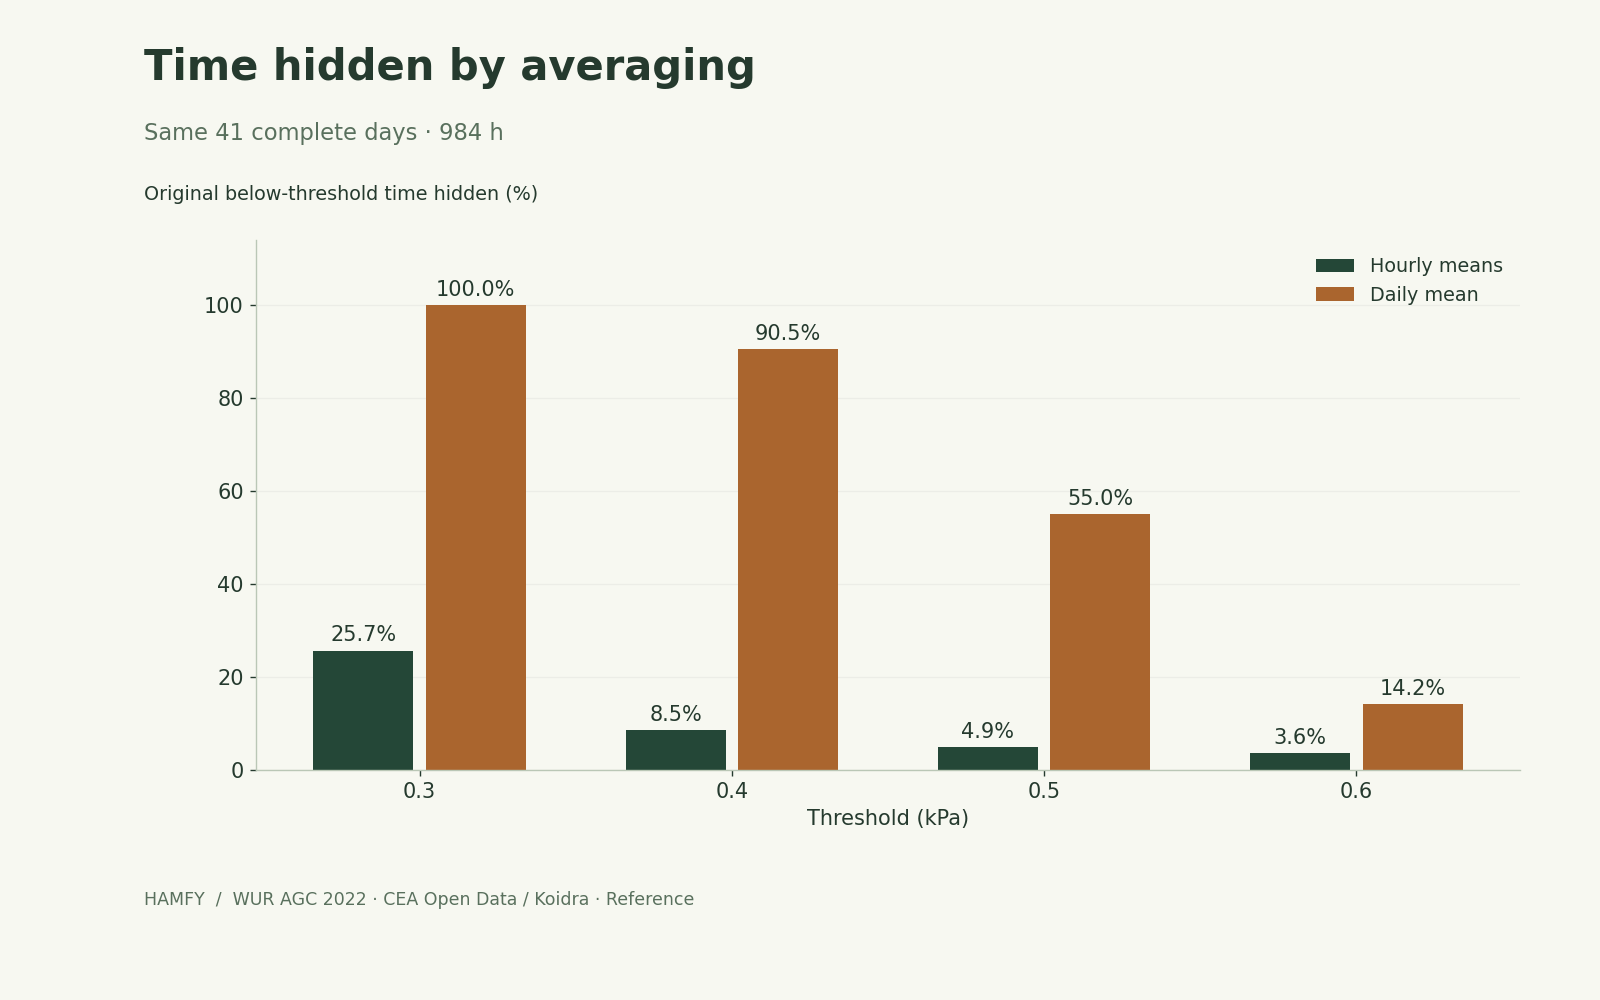
Daily means hide 255.75 of the original 282.75 below-threshold hours at 0.4 kPa. This percentage applies to this cohort and rule.
A similar total can mislead
Hourly means classify 277 h below, close to the original 282.75 h. But they hide 24.08 h and introduce 18.33 h elsewhere.
Keep the original record
Use daily means for an overview. Review coverage, excursions and alert logic against the finest available measurements.
One sensor stream, the same 41 complete days
We used the primary temperature and relative-humidity stream from the public Reference greenhouse export. The source has 12,384 rows from 1 February to 15 March 2022. Its data dictionary and provenance describe a lettuce experiment. Our earlier sensor comparison asked which stream was used; this analysis holds the stream constant and changes the averaging interval.
We excluded 3 March because 25 pairs were missing and 15 March because its last reading has no following interval. The remaining 11,808 five-minute intervals cover 984 nominal hours. We corrected one-minute timestamp jitter onto a regular grid, never filled missing climate values, and used the source clock. Air VPD is calculated for each pair with the FAO saturation-pressure equation before averaging. All comparisons use exactly this same complete-day cohort.
The mean stays the same. The flags do not.
For each clock hour or day, we average the calculated VPD and assign that mean to its original intervals for comparison. The rule is strictly VPD below 0.4 kPa. An interval is hidden when the original is below but the mean is not; it is introduced when the opposite happens. These are retrospective review flags, not the experiment’s alarm log or a crop setpoint.
Daily means classify only 48 h as below the threshold. That net total combines 255.75 h hidden and 21 h newly classified below. Hourly means lose less information, but their similar total conceals changes in timing. None of the three representations changes the overall mean of 0.545 kPa.
Same measurements, different classifications
| Representation | Below 0.4 kPa (h) | Hidden (h) | Introduced (h) |
|---|---|---|---|
| Five-minute record | 282.75 | 0 | 0 |
| Hourly VPD means | 277.00 | 24.08 | 18.33 |
| Daily VPD means | 48.00 | 255.75 | 21.00 |
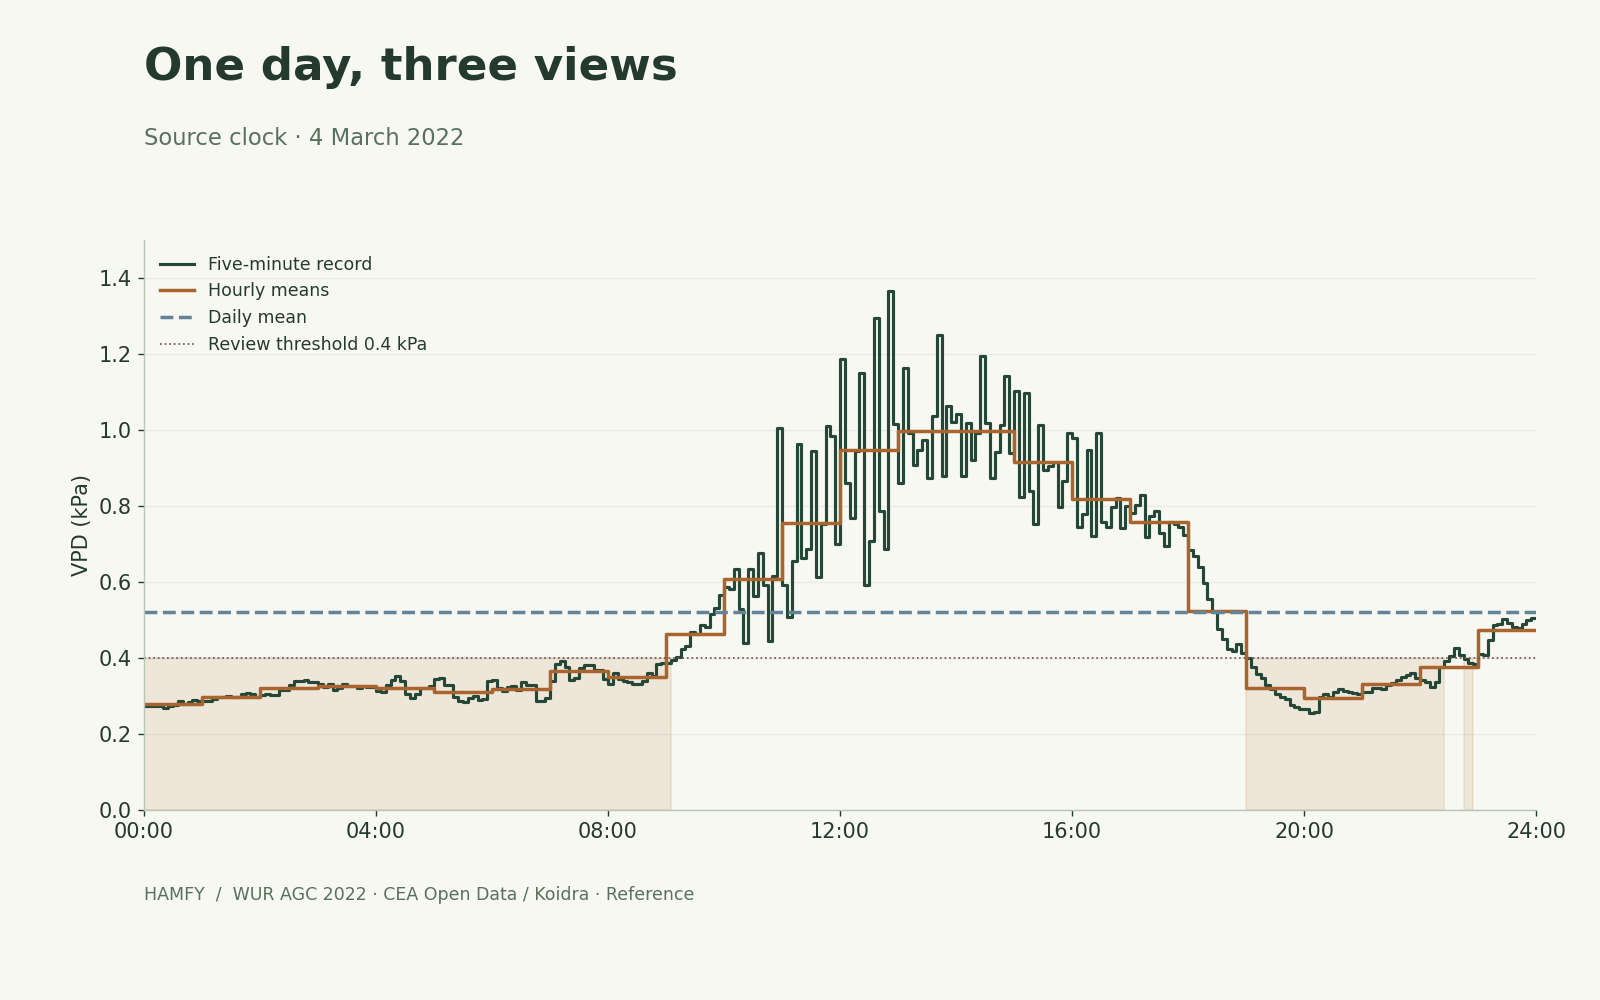
A daily mean of 0.520 kPa can hide almost 13 hours below 0.4
On 4 March, the five-minute record spends 12 h 55 min below 0.4 kPa, although its daily mean is 0.520 kPa. We deliberately illustrate the day with the largest hidden duration, not a random or typical day. Across the full cohort, 34 days have a mean at or above the threshold and still contain below-threshold intervals. That does not establish 34 crop incidents.
The detail a flat daily line removes
The result depends on the review threshold
We repeated the comparison at 0.3, 0.5 and 0.6 kPa. Daily means hide 100.0%, 55.0% and 14.2% of the corresponding original below-threshold time. Each percentage has a different denominator. At 0.6 kPa, daily means actually classify more total time below than the original record. The 90.5% result is not a universal failure rate for daily averages.
Four thresholds, one unchanged cohort
What to keep in a useful growing dashboard
Averages remain useful for an overview. For operational review, keep them beside measurements of variability and availability. Our VPD calculator and printable chart explain individual conditions; the CSV sensor analyser helps review a time series.
- Keep the original export and show the available duration, not just the number of rows.
- Show time outside the agreed range, minimum and maximum, and the time series alongside the mean.
- Check sensor placement, calibration, alert delay and hysteresis before changing controls. Even five-minute records miss shorter changes.
Inspect the method, rerun the result
Download the analysis package: unchanged input, licenses, Python code, exact results and chart code. The calculations require only the Python standard library. Our independent NumPy/pandas check agrees for every threshold and resolution.
This observational analysis covers one greenhouse stream. It does not measure crop losses, disease, condensation, savings or sensor accuracy. The complete-day selection excludes incomplete days and may not represent them. The five-minute record is a temporal baseline, not continuous measurement or proof that an alarm should have fired.
Common questions
Is VPD calculated from average temperature and humidity the same?
No. VPD is nonlinear. On the illustrated day, using mean temperature and RH gives 0.486 kPa, whereas averaging per-reading VPD gives 0.520 kPa. Our main comparison always calculates VPD first; it does not mix these two operations.
Should every grower use 0.4 kPa as an alarm threshold?
No. It is a stated review rule for this analysis, not a universal crop target. An operational threshold depends on crop, stage, measurement location and the control strategy. The source does not identify actual alarms or crop effects caused by these intervals.
Sources & research
Primary sources selected for this article. Reviewed by Hamfy on .
Research brief: climate aggregation and hidden VPD intervalsRead the research brief · scope, findings and limitations- Public dataset · 2022–2023AGC 2022: first lettuce experiment, data dictionary and provenanceCEA Open Data / Koidra Tech Inc.; WUR AGC
Pinned source version; Reference compartment, Tair and Rhair. MIT permission and the unchanged input are included in our package.
- Primary method · 1998FAO-56, Chapter 3: Meteorological dataFAO
Saturation-vapour-pressure equation used for air VPD. It does not supply the 0.4 kPa review threshold used in this study.
Have a correction or additional project evidence? Contact the Hamfy team.
What do the averages in your dashboard hide?
We can review the quality, coverage and time patterns in your growing data and agree which signals deserve a closer look.