LED Grow Light Distance: Set the Right Height with PPFD and DLI
How far should LED grow lights be from plants? Map PPFD at canopy level, compare uniformity, adjust height and dimming, then check the daily light integral.
Explore the guide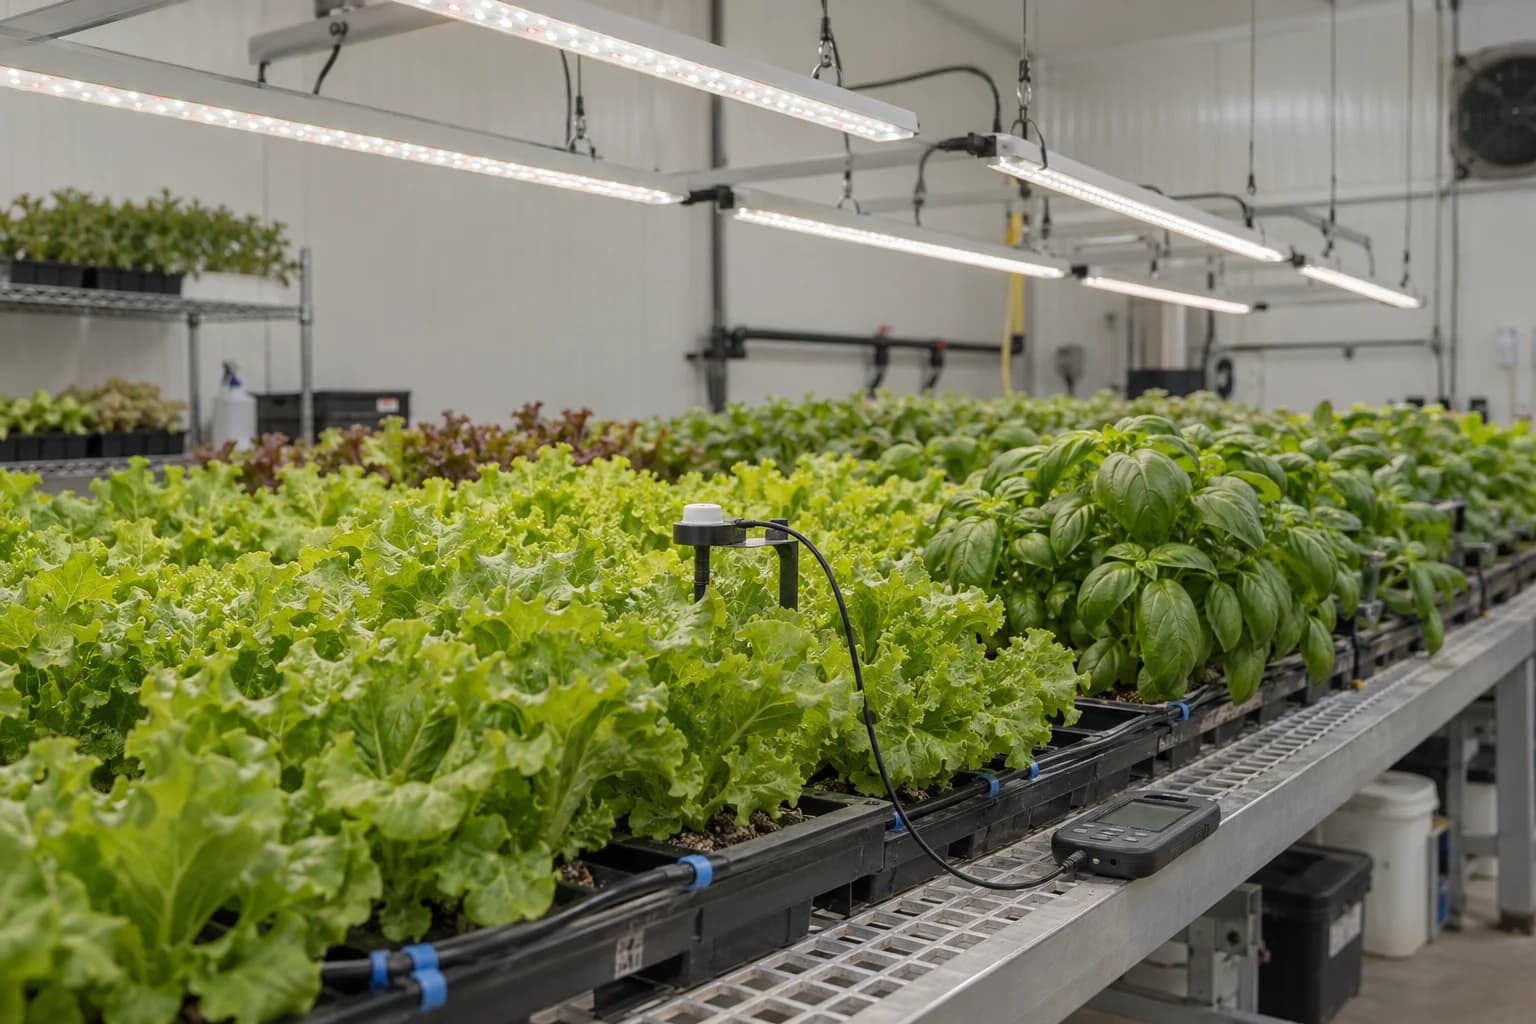
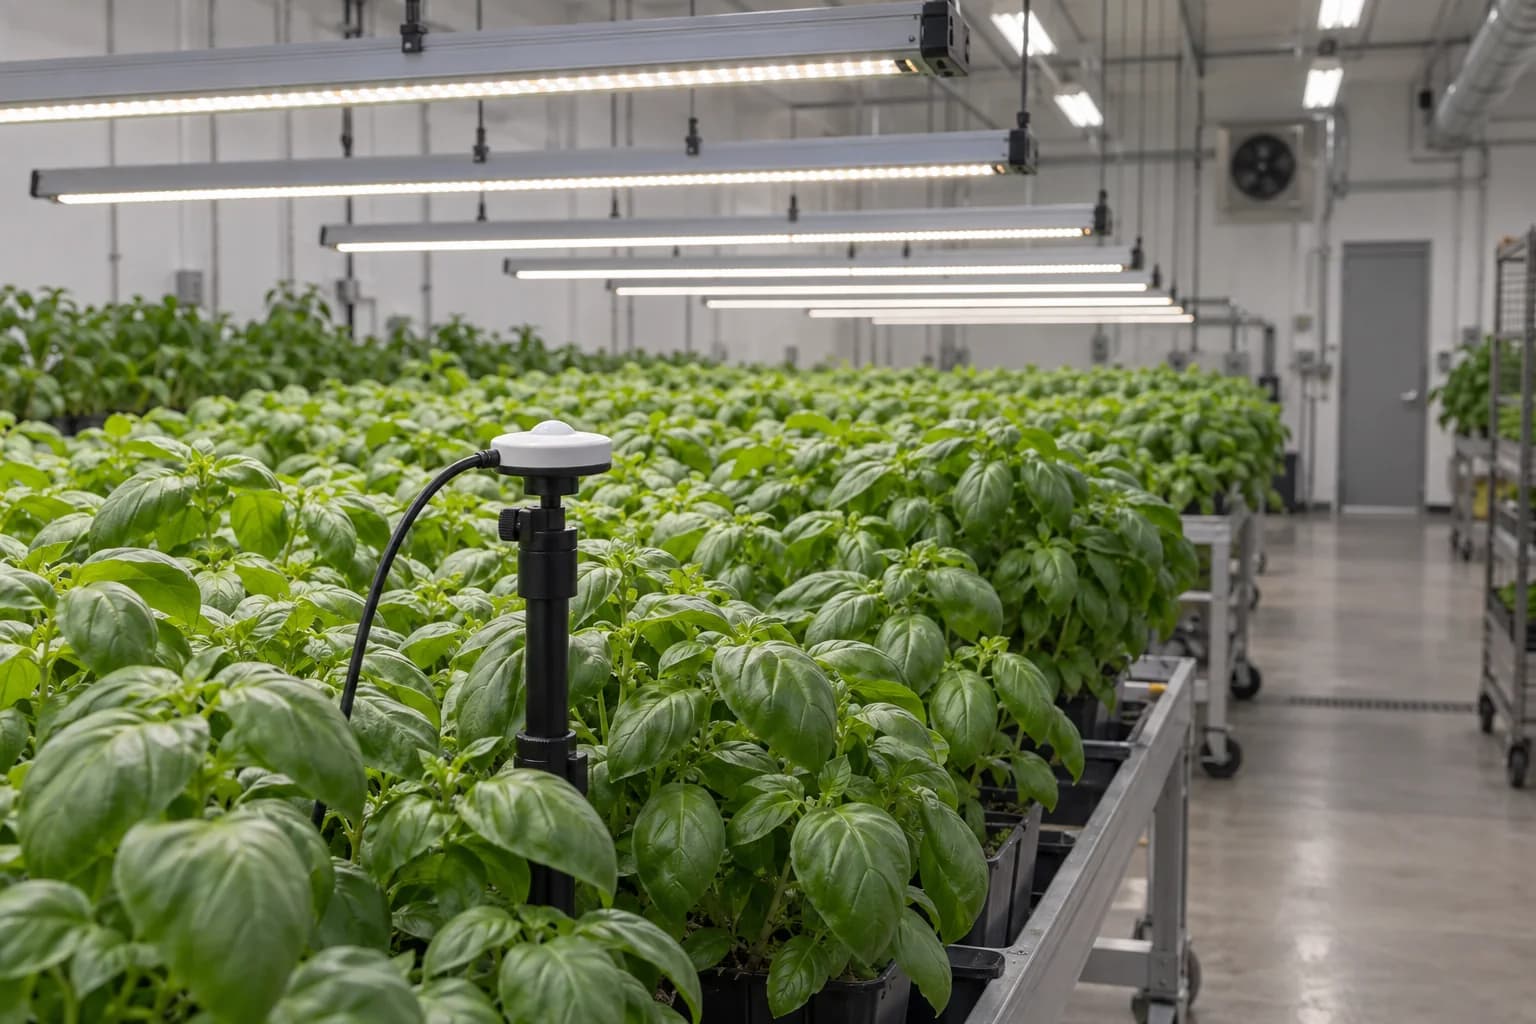
There is no single correct LED-to-plant distance. Start within the fixture manufacturer's mounting limits, then measure the light actually reaching the crop. A repeatable PPFD map tells you much more than wattage, a bright centre spot or a photograph of the room.
Measure a surface
Check the centre, edges and overlap between fixtures at the actual canopy height.
Separate two adjustments
Height changes distribution; dimming changes output. Recheck both after an adjustment.
Include time
PPFD describes an instant. DLI includes the duration of exposure.
How far above plants should an LED grow light hang?
Use the manufacturer's installation and clearance instructions as the starting boundary, not as proof of a suitable crop light level. Fixture optics, spacing, reflective walls and canopy height all change the result. Select a crop- and stage-specific light objective before adjusting the installation. General household guidance on light and distance cannot establish the mounting height of every commercial LED array.
Build a PPFD map at canopy height
Divide a representative growing area into a repeatable grid. Hold a suitable quantum sensor level at the crop surface; avoid shading it with your body. Record every point, including edges and fixture overlaps. Keep dimming, canopy height and background light constant. MSU's lighting-plan guidance explains why a centre reading cannot describe an installation. Use more points for large areas or obvious gradients; nine points below are only a teaching example.
A bright centre can hide darker edges
PPFD · µmol m⁻² s⁻¹
| Grid row | Left | Centre | Right |
|---|---|---|---|
| 1 | 210 | 260 | 220 |
| 2 | 280 | 360 | 290 |
| 3 | 200 | 250 | 210 |
Adjust height and dimming one step at a time
Compare the mean, lowest and highest PPFD as well as their locations. In the example, the mean is 253.3 µmol m⁻² s⁻¹ and the minimum-to-mean ratio is 0.79. That ratio describes this grid; it is not a universal pass mark. Raising a fixture can change spread and losses, while dimming mainly changes output. Neither effect should be assumed proportional across different fixtures. Change one setting, repeat the same grid and compare.
Let the map guide the next adjustment
| Observed pattern | What to investigate | What to verify afterwards |
|---|---|---|
| Bright centre, darker edges | Fixture layout, mounting height and overlap | Repeat the full grid; check losses outside the crop |
| Fairly even but too much light | Dimming within the fixture's operating range | PPFD map and resulting DLI |
| Fairly even but too little light | Output, fixture spacing and usable coverage | Intensity, distribution and leaf response |
Convert the measured light into DLI
For constant PPFD, DLI = PPFD × lighting hours × 0.0036. At 250 µmol m⁻² s⁻¹ for 16 hours, the result is 14.4 mol m⁻² d⁻¹. The same arithmetic result at 400 for 10 hours does not establish the same crop response: photoperiod and intensity still matter. With daylight or scheduled dimming, integrate the changing light instead. Check the calculation in our PPFD and DLI tool.
Check the measurement before changing the crop
Use a quantum sensor appropriate to the spectrum being measured. Apogee's spectral-response guidance shows why different sensors can disagree under the same lamp. A lux meter or an uncalibrated phone app is not interchangeable with a suitable PAR measurement. Record sensor model and calibration status. If leaves show stress, also check leaf temperature, water supply and recent changes rather than diagnosing excess light from appearance alone.
Keep a commissioning record that can be repeated
Download the blank PPFD measurement sheet, with English column labels. Record fixture, distance to the canopy, dimmer setting, photoperiod and all grid points. Repeat after substantial crop growth, fixture movement or replacement. For selecting the wider installation, continue with our PPFD and DLI specification guide. A useful record links the setting to a measured distribution, not merely to a dial position.
Common questions
Is 30 cm the right distance for every LED grow light?
No. Distance recommendations depend on the fixture, optics, layout and crop. Respect the installation clearances and verify PPFD at canopy height.
Can I calculate PPFD from the wattage on the box?
Not reliably. Electrical power alone does not tell you photon output, distribution or the amount reaching a particular point on the crop.
Should I measure in the centre or at the edges?
Both. A grid reveals uneven coverage that a single centre reading misses. Use the same positions when comparing settings.
Does the same DLI mean the same growth?
No. DLI summarises daily light quantity. Intensity, photoperiod, spectrum, crop stage and other conditions still affect the response.
Sources & research
Primary sources selected for this article. Reviewed by Hamfy on .
Evidence brief: commissioning LED height with a PPFD mapRead the research brief · scope, findings and limitations- Technical source · 2017Lighting Plans: Their Generation and ImportanceMichigan State University
Explains how fixture geometry, output and placement affect a lighting plan and why delivered light should be measured.
- Technical source · n.d.Quantum PAR Sensor Spectral Error Estimation ToolApogee Instruments
Manufacturer guidance on quantum-sensor spectral mismatch; used for measurement limitations, not a product ranking.
- Technical source · n.d.Lighting for indoor plantsUniversity of Minnesota Extension
Basic horticultural lighting context. Household mounting examples are not transferred to commercial fixtures.
Have a correction or additional project evidence? Contact the Hamfy team.
Turn observations into useful decisions
Discuss a monitoring plan with Hamfy: what to measure, where to measure it and which evidence an alert should trigger.