Sensor-Based Irrigation: When to Water and How to Verify Delivery
A practical control loop for substrate-grown crops: calibrate moisture sensors, verify flow and pressure, and check the response after each irrigation pulse.
Explore the guide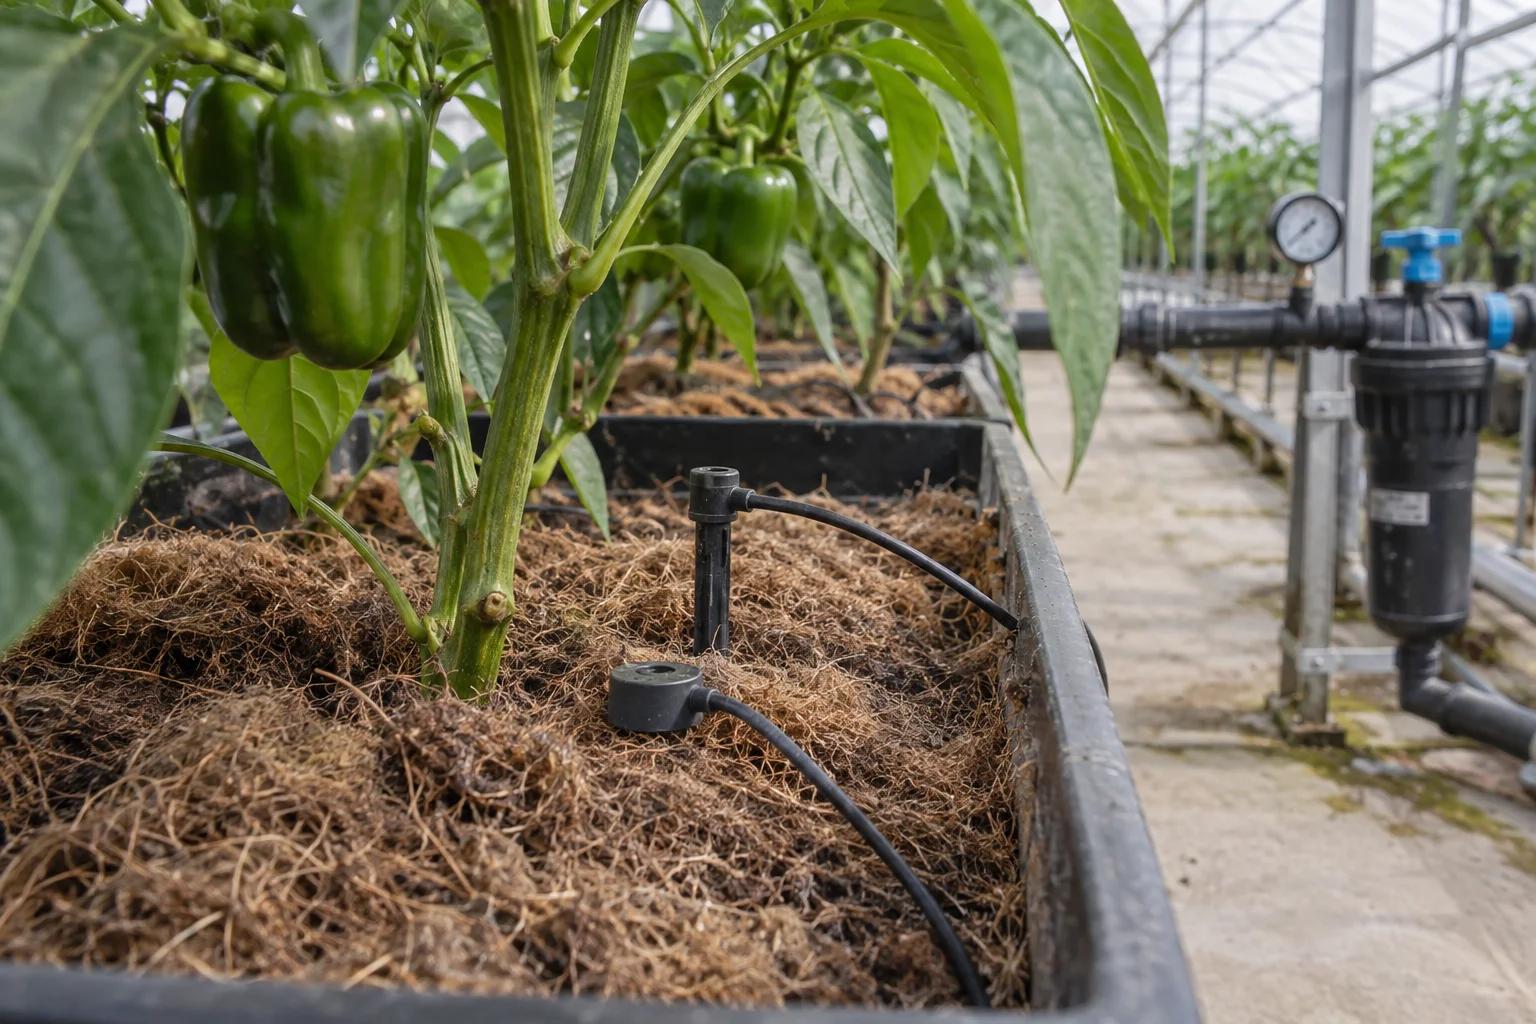
A valve opening is an instruction, not proof that water reached the roots. Reliable sensor-based irrigation connects a crop’s demand, a valid substrate measurement, delivered flow and the response after watering. Build that loop for a defined growing zone before expecting automation to reduce work or water use.
Calibrate to the medium
A percentage needs a sensor model, substrate and installation context.
Verify delivery
Combine valve state with measured flow, pressure and local emitter checks.
Close the loop
Allow time for redistribution and inspect the response before repeating a pulse.
Define a zone that can share one irrigation decision
Group plants by crop, growth stage, container, substrate and hydraulic supply. Identify sunny edges, different pot sizes and other conditions that may need a separate zone. Write down the acceptable root-zone moisture range with the crop manager and distinguish routine triggers from emergency limits. A clock-based programme is a useful baseline to measure against. The proposed upgrade should answer a clear question, such as whether watering stays appropriate as the canopy grows or whether failed delivery is detected promptly.
Make the moisture reading meaningful
Volumetric water content expresses the fraction of substrate volume occupied by water. It is not the same as the fraction of plant-available water. Check the manufacturer’s calibration for the actual medium, its salinity range and temperature behaviour. Install probes with consistent contact, depth and position relative to the emitter. Air gaps, disturbed media and a probe in a locally saturated pocket can distort the decision. Use several representative points during commissioning and compare with an independent agreed reference rather than trusting one convenient pot.
Use bounded pulses with time to observe the result
Nemali and van Iersel’s 2006 experiment demonstrated moisture-triggered irrigation with calibrated sensors and valves in potted plants. Original experiment. It supports the feedback principle, not copying its set-points into another substrate or crop. Hamfy’s proposed sequence is: validate the reading, confirm irrigation is permitted, deliver a bounded pulse, then wait an agreed redistribution interval before reassessing. Separate that interval from the maximum allowed delay when the crop is genuinely too dry. Keep a daily volume limit and a defined operator escalation.
The diagram below uses invented moisture readings to show why the immediate post-pulse value and the later settled value differ. It is not a measured crop response or a recommended threshold. During a real trial, retain raw readings, command time, pulse duration and delivered volume; otherwise a trend cannot distinguish plant demand from a change in the irrigation programme.
Observe the response after the pulse
Substrate water content (%)
| Elapsed time (min) | Substrate water content (%) |
|---|---|
| 0 | 35 |
| 10 | 34 |
| 20 | 32 |
| 25 | 36 |
| 35 | 38 |
| 50 | 37 |
Check the hydraulic system as well as the software
UGA’s startup checklist pairs system maintenance with pressure and flow checks. Delivery checks. Record expected zone flow at an operating pressure, then test representative emitters near the beginning and end of laterals. Consider filter condition, line filling, leaks and drainage between pulses. A normal total flow does not prove uniform delivery to every container. Keep water quality and deposits in the investigation through our pH and EC guide. A software dashboard cannot compensate for an unbalanced or blocked distribution system.
Use a volume check to challenge the command
Worked example with assumed steady flow: 100 emitters at 2 L/h running for 3 minutes would deliver 10 L in total, or 0.1 L per emitter. Compare this expectation with the zone meter after allowing for its resolution and the system’s filling and draining behaviour. A measured 6 L is a discrepancy to investigate, not proof of a particular fault. Check pressure, actual run time, blockage and meter operation before changing the moisture target. Short pulses make those transient effects especially important.
From emitter specification to a zone-volume check
| Assumed input | Value | Interpretation |
|---|---|---|
| Emitter count | 100 | All emitters active |
| Flow per emitter | 2 L/h | At the specified operating pressure |
| Pulse duration | 3 min | 0.05 h |
| Expected total | 10 L | 100 × 2 L/h × 0.05 h |
| Expected per emitter | 0.1 L | Steady-flow approximation |
Design responses for missing or conflicting evidence
If the command is on but flow is absent, check the pump, supply, valve and instrumentation. If total flow looks normal but one location remains dry, check local delivery and probe placement. If flow continues after shutdown, investigate a leak, siphoning or a valve fault. Stale, impossible or frozen sensor readings should not silently request unlimited watering. Define bounded fallback behaviour with the grower, notify the assigned operator and keep a manual recovery procedure. The safest response depends on the crop and equipment; automatic shutdown is not universally sufficient.
Evaluate crop outcomes and water use together
Compare matched zones or comparable cycles using total delivered water, drainage, substrate trends, interventions and marketable output. Record radiation, growth stage and major climate changes so a cloudy week is not mistaken for a controller improvement. If fertigation is involved, include the agreed root-zone and drainage checks rather than pursuing minimum drainage regardless of salt balance. Use the sensor-data analyser to inspect missing values and timing. Hamfy proposes this record as a basis for control improvements; it does not establish a guaranteed saving or replace crop judgement.
Common questions
Is there one correct moisture percentage for every substrate?
No. Sensor calibration, medium, container, root development and crop requirements all matter. Establish a measured operating range for the defined zone.
Does normal total flow prove that all plants were watered?
No. The total can conceal uneven distribution. Check representative emitter output and local substrate response as well as zone flow.
Does sensor-based irrigation need AI?
No. A validated rule-based feedback loop is a useful starting point. Predictive control should be compared against that baseline using reliable data and bounded actions.
Sources & research
Primary sources selected for this article. Reviewed by Hamfy on .
Evidence brief: closing the irrigation feedback loopRead the research brief · scope, findings and limitations- Research / technical guidance · 2006An automated system for controlling drought stress and irrigation in potted plantsKrishna S. Nemali and Marc W. van Iersel · Scientia Horticulturae
Original 2006 potted-plant experiment by Nemali and van Iersel. It supports the feedback principle, not universal moisture thresholds.
- Research / technical guidance · 2016Drip Irrigation Checklist: Start-UpChavez, Coolong, Wells and Porter · UGA Cooperative Extension
University checklist for hydraulic inspection and startup checks; the field context must be adapted to the greenhouse zone.
Have a correction or additional project evidence? Contact the Hamfy team.
Turn a growing problem into a measurable brief.
Bring your room layout, crop programme and existing records. We can discuss the sensors, controls and evidence needed for your next step.